How MBRS evaluates biological risk
MBRS is a biology-first system designed to surface differentiation, mispricing, and landscape shifts before clinical outcomes are known.
We quantify how drugs interact with biology, how those interactions translate into disease-relevant effects, and how each program compares within its competitive landscape.
Biological modeling & signal extraction
Systematically model drug–biology interactions to identify the underlying signals that drive efficacy and risk.
Disease alignment & outcome inference
Evaluate whether those signals restore, conflict with, or amplify disease biology to infer likely outcomes.
Ecosystem mapping & differentiation
Position each asset within its indication landscape to measure competitive density and biological advantage.
Integrated scoring & issuance
Combine signals into standardized outputs that enable cross-program comparison and decision-making.
Where MBRS is currently most useful
We model mechanistic-biological risk, not regulatory approval or failure. The oracle run below asks a narrower and more useful question: when MBRS makes a high-margin biological call, does that stronger separation align with labeled real-world outcomes often enough to support risk triage and prioritization?
Reading the deployed oracle run CSVs from the public plots folder.
Use MBRS as a biological risk-prioritization layer: high-margin calls help flag programs that deserve deeper diligence, comparison, or caution.
MBRS is not presented as a standalone regulatory approval predictor; lower precision and calibration scores are shown to keep that boundary explicit.
The current demo set is oncology-heavy, where approval decisions can accept more toxicity and uncertainty than many other indications. That can blur direct approval/failure calibration.
| Decision setting | Reported benchmark | Why it matters for MBRS |
|---|---|---|
| Drug development base rate | ~14% Phase I→approval (2006–2022) | Low base rate → small signal improvements matter |
| Current clinical success environment | 10.8% overall success (2023); Phase I 48%, Phase III 66% | Uncertainty persists late → biology signal remains relevant |
| VC portfolio reality | Majority of VC funds underperform public markets | Power-law outcomes → filtering matters more than prediction |
| BD / M&A execution | Frequent miss on timelines and revenue post-acquisition | Forecast error risk → biology adds downside checks |
| MBRS high-margin subset | — accuracy on — of labeled approval/failure calls. | Core signal: high-confidence biological separation |
| Class | Precision | Recall | F1 | Correct / total | Mean margin | Calibration | Readout |
|---|---|---|---|---|---|---|---|
| Loading class-level metrics… | |||||||
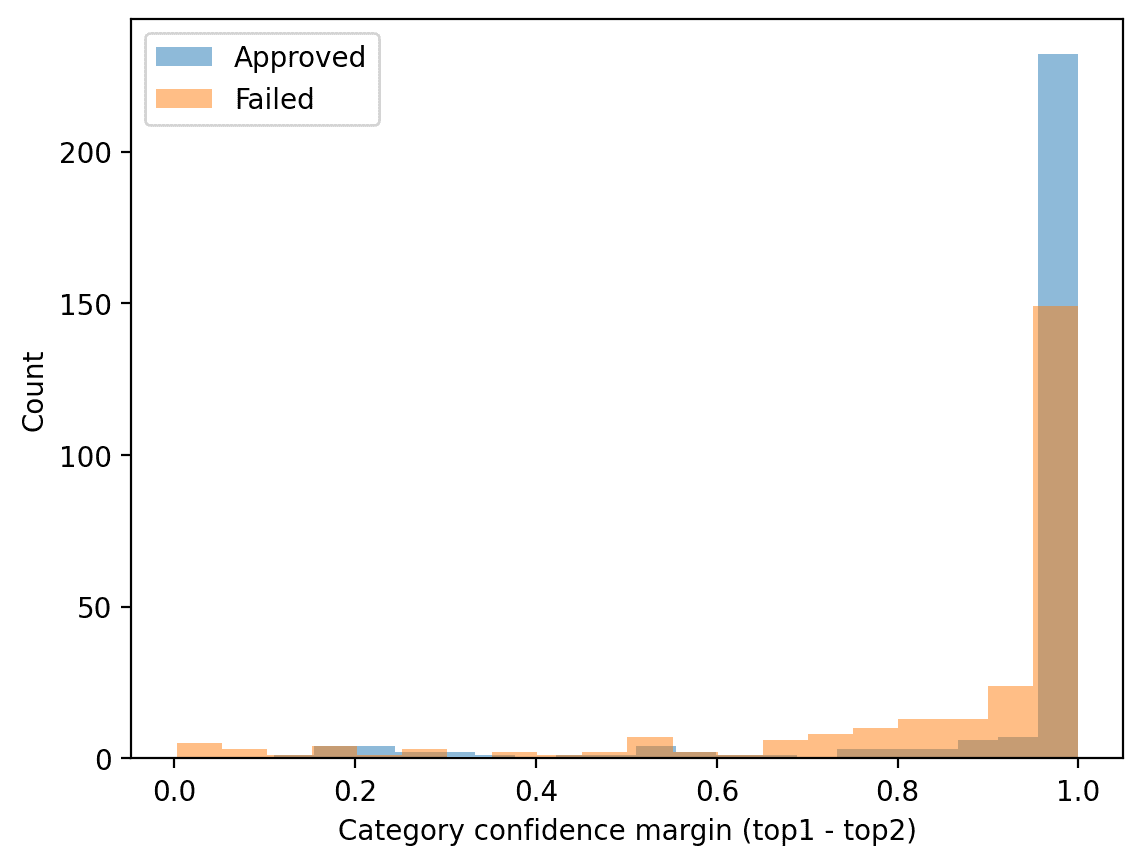
Category margin shows how separated the model’s top biological call is from the competing class. This is the current advantage: margin filtering reveals the subset where MBRS is most informative, without overstating it as outcome prediction.
Simple readout: MBRS is strongest when margin is high. At that threshold, biological separation aligns with outcomes at a useful rate. Broad approval/failure metrics remain calibration-limited and should be treated as context, not the core signal.
Note: this page is intentionally high-level. Proprietary methods and model details are omitted.